Venn Diagrams in LaTeX
Feb 04, 2023 00:00
I wrote a 2017 post describing how I code Venn diagrams in LaTeX with TikZ. Venn diagrams in categorical logic tend to be different from their standard uses in mathematics. There are a few LaTeX packages for Venn diagrams, but, for some reason, I didn’t think they could be used to produce the diagrams I needed for my critical thinking course. I should have looked at them a bit more carefully, it turns out that making the diagrams using the venndiagram package is much easier than my method.
Venndiagram, like my method, uses TikZ to make the diagram. The advantage, though, is that we don’t have to dig into the details of TikZ for everything, that is already done for us. For example, here is the code for the diagram for an A-sentence using my previous method.
\begin{tikzpicture}[thick,scale=1, every node/.style={transform shape}]
  \begin{scope}
    \begin{scope}[even odd rule]
      \clip \pred (-1.5,-1.5) rectangle (1.5,1.5);
      \fill[gray] \sub;
    \end{scope}
    \draw (-2,-0) node {$A$};
    \draw (4,0) node {$B$};
    \draw \sub;
    \draw \pred;
  \end{scope}
\end{tikzpicture}
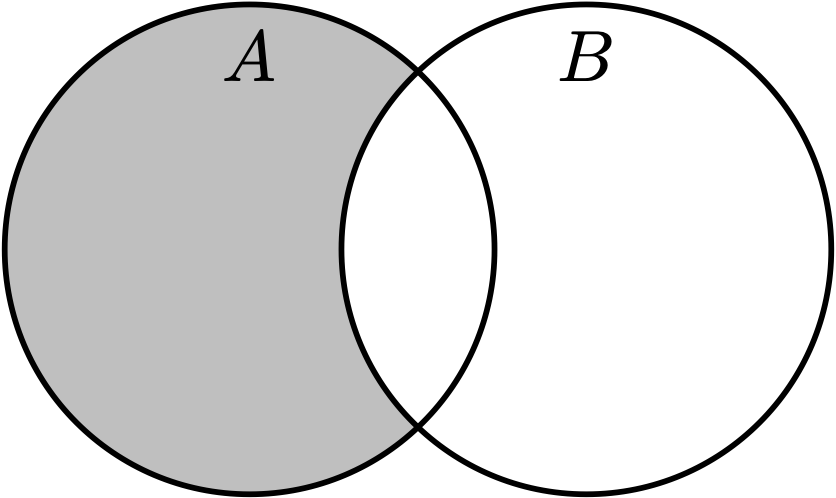
Here is the code for the same diagram with the venndiagram package.
\begin{venndiagram2sets}
  [tikzoptions={scale=1,thick}, showframe=false]
  \fillANotB
\end{venndiagram2sets}
It produces this:

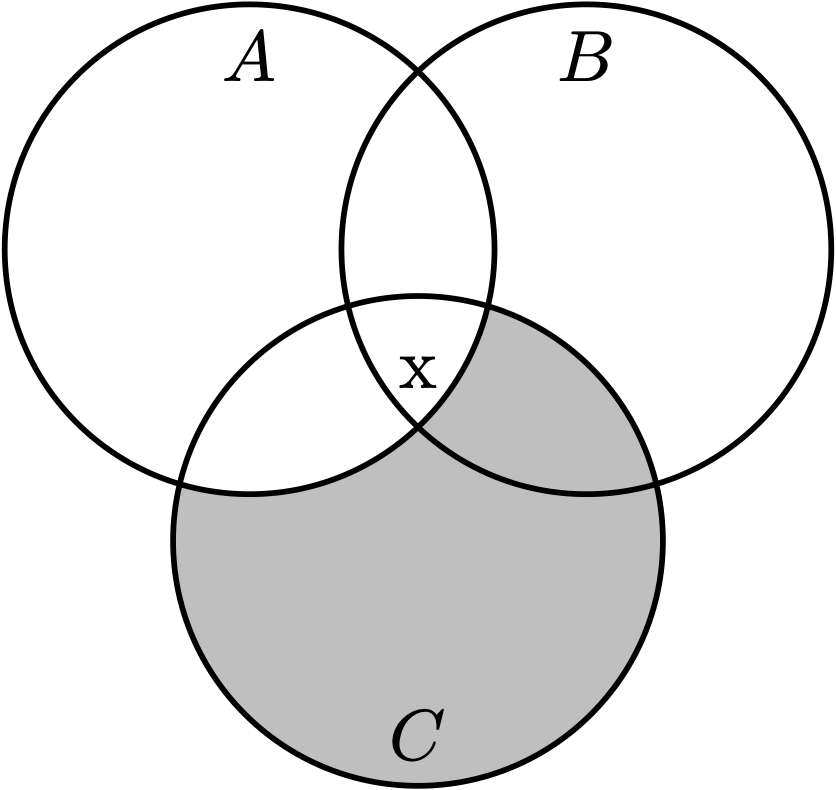
Here’s the code for Disamis (IAI-3):
\begin{venndiagram3sets}
  [
  tikzoptions={scale=1,thick},
  showframe=false,
  labelOnlyB={x},
  labelABC={x}
  ]
  \fillCNotA
\end{venndiagram3sets}
The resulting diagram looks like this:

There was no way that I could remember my all of the details of my original method, so I had an 84-line snippet that I inserted for each diagram. I would then comment and uncomment various lines to produce the diagram I needed.
Now, I just use this snippet for a 2-circle diagram:
\begin{venndiagram2sets}
  [
  tikzoptions={scale=1,thick},
  showframe=false,
  labelA=S,
  labelB=P,
  labelOnlyA={x},
  labelAB={x}
  ]
  \fillANotB
\end{venndiagram2sets}
I use this for a 3-circle diagram:
\begin{venndiagram3sets}
  [
  tikzoptions={scale=1,thick},
  showframe=false,
  labelA=S, %label circle A with "S"
  labelB=P, %label circle B with "P"
  labelC=M, %label circle M with "M"
  labelOnlyA={x}, %puts an "x" in the region belonging only to A
  labelOnlyBC={x}, %puts an "x" in intersection of B and C.
  labelABC={x} %puts an "x" in the the intersection of A, B, and C.
  ]
  \fillANotB %fills the region belonging only to B
  \fillBCapC %fills the intersection of B and C.
  % To put an x on the lines, uncomment the following:
  % \setpostvennhook % places an "x" in other locations of the diagram.
  % {
  % \node[above = 1.6cm of labelC] {X};
  % \node[above left = 1.4cm and .25cm of labelC, rotate=45] {X};
  % }
\end{venndiagram3sets}
Both have enough detail that I can remember what to change to make a particular diagram. I’ve added some extra comments to explain what everything does. I Include the scale=1 only so that I can remember what to do when I want to change the size of the diagram. The only tricky part is when I have to place an x on the border of a particular circle, that requires a little bit of TikZ fiddling, hence the commented lines at the end of the snippet.